
Description
S-1409 Plane6 Surface Plate Calibration Software
Hamar Laser’s Plane6 Surface Plate Calibration software is designed to quickly guide you through the steps to check the calibration of a surface plate. It features easy-to-understand screens to quickly set up the hardware and get ready for the data-taking using the Moody Method. Enter the surface plate dimensions, the edge width, the number of points, the grade, temperature for the upper and lower parts of the plate and Plane6 calculates the measurement point distances along each of the 8 lines. The data sampling is configurable by the user to handle many different environments. The standard sampling rate records a point in about 4 seconds, which is 3-4x faster than most electronic levels. After recording, the measurement report is generated and can be printed to PDF for easy emailing to customers or managers.
Click on Features tab to see a description of each individual screen.
Applications
Applications include:
- Granite surface plates
- Steel surface plates
- Guideways
Features
Easy 4-Step Process
Plane6 guides the user through the alignment with a 4-step process, designed to record flatness data in the most efficient way. First, enter the plate dimensions, border width and number of points per line. Then choose the grade of the plate. Plane6 automatically loads the overall flatness tolerance for that size plate.
Next, go to Step 2 Data Collection and select the line you want to measure. Plane6 automatically calculates the measuring point dimensions and displays the dimension for the next point. Record the value and Plane6 jumps the position to the next point and shows the dimension for it. Continue until all the lines are measured. Then go to Step 3 Results to see the overall flatness and also the data tables for each line. To see a rotatable graph of the overall plot, go to Step 4 Graph.
Program Features – 4-Step Process
Step 1: Surface Plate Layout and Calibration Grade
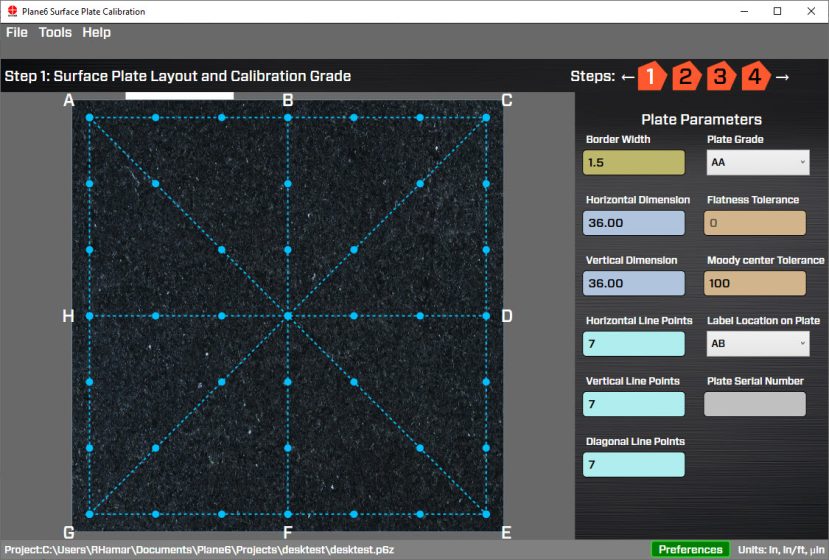
Step 1: Surface Plate Layout and Calibration Grade is used to enter the plate dimensions, border width and number of points per line. Also choose where to locate the name plate. Then choose the grade of the plate. Plane6 automatically loads the overall flatness tolerance for that size plate.
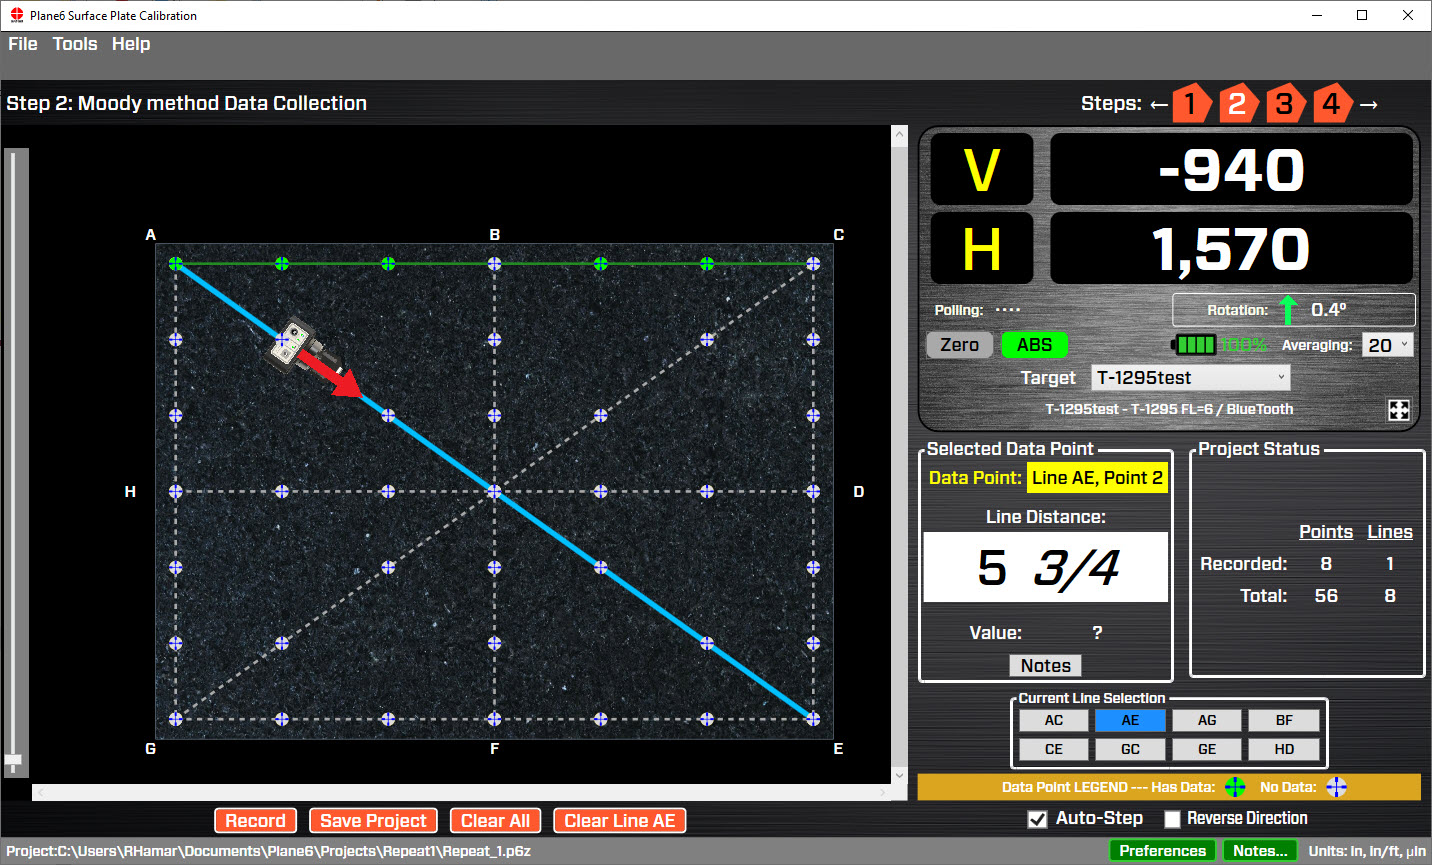
Step 2: Data Collection – Plate View
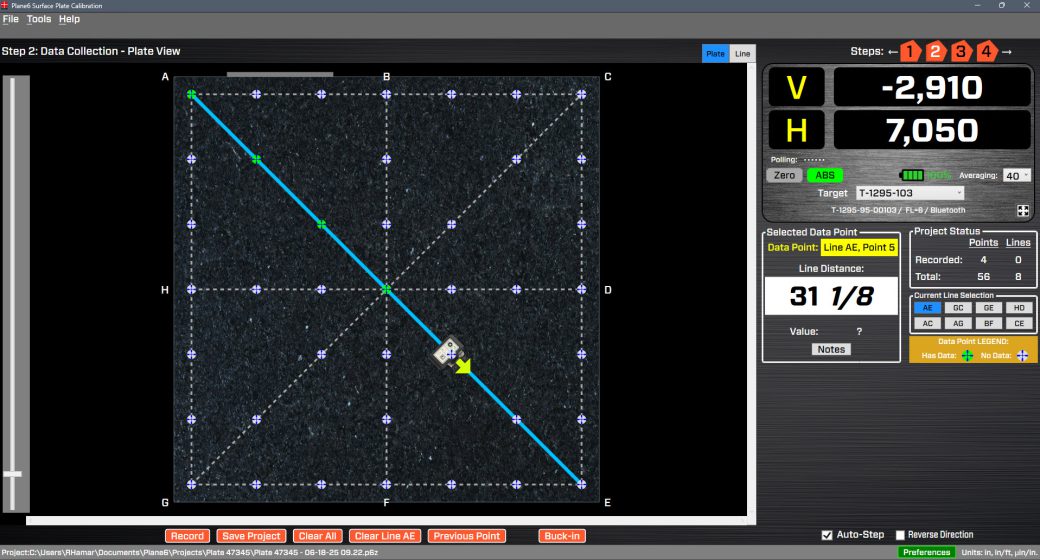
Step 2 – Data Collection – Plate View is used to record the flatness data. Plane6 guides you through the fastest way to take the data. It starts off with line segment AE. Once the laser is set up, you click Record to take the first data point. Then Plane6 automatically moves the target icon to the next point and displays the Line Distance (see Selected Data Point display area) on the straightedge scale to place the target for the next point. The recorded-point icon changes color to green to indicate data has been taken. Continue until all the lines are measured. You can reverse the direction of the data taking for a given line and retake any point. A target icon tells you what point you are on and what direction its going. You can also hover over or click on a point to see the value recorded. The data updates in real-time and it has an adjustable sampling rate. When done recording a line, Plane6 automatically selects the next line in the sequence (see the Current Line Selection display area).
Step 2: Data Collection – Line View (optional)
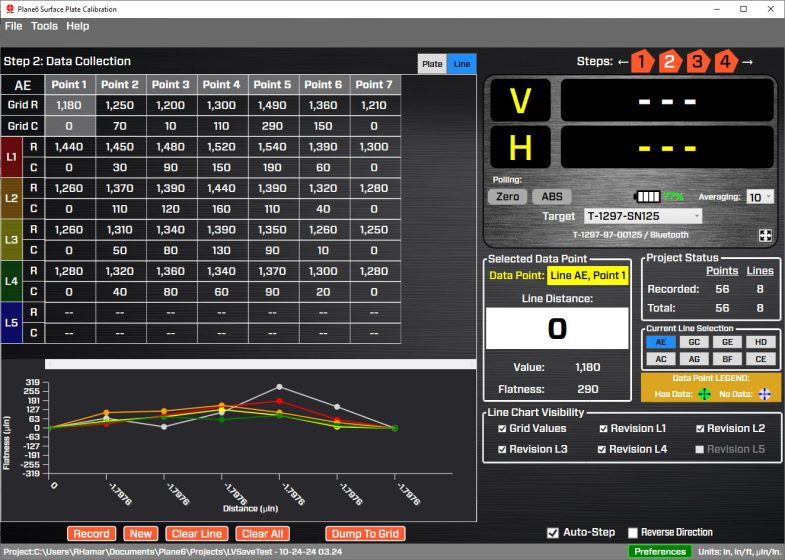
Step 2 – Data Collection – Line View is used to record the flatness data for an individual line during the lapping (resurfacing) process when the plate fails calibration. After resurfacing the plate to use Line View, you first select the file with the previously recorded plate data, then go to Step 3, and look at the data tables to find the line with the highest flatness error. Go back to Step 2 and click on the Line View tab, select the line segment from the Current Line Selection display area and Plane6 automatically loads the data for that line segment from the saved file. Then setup the laser, straightedge and target, position the target at the first point and hit Record. Continue to record the data for that line until finished. Plane6 will then zero the end points, calculate the flatness error for each point and plot the data in the graphing area. It also shows a graph of the previously recorded plate data for comparison. If the flatness error is not acceptable, you can repeat the process and record a second set of data. It will also be plotted along with the 2 previous sets of data but with a different line color. You can take up to 5 sets of data.
If the flatness data is acceptable, then you can click on Dump to Grid and Plane6 will load the data from that line segment into the overall plate data and you can go to Step 3 to see if the flatness data is now in spec. If so, then you should re-record the full plate data to confirm the results.
Step 3: Results
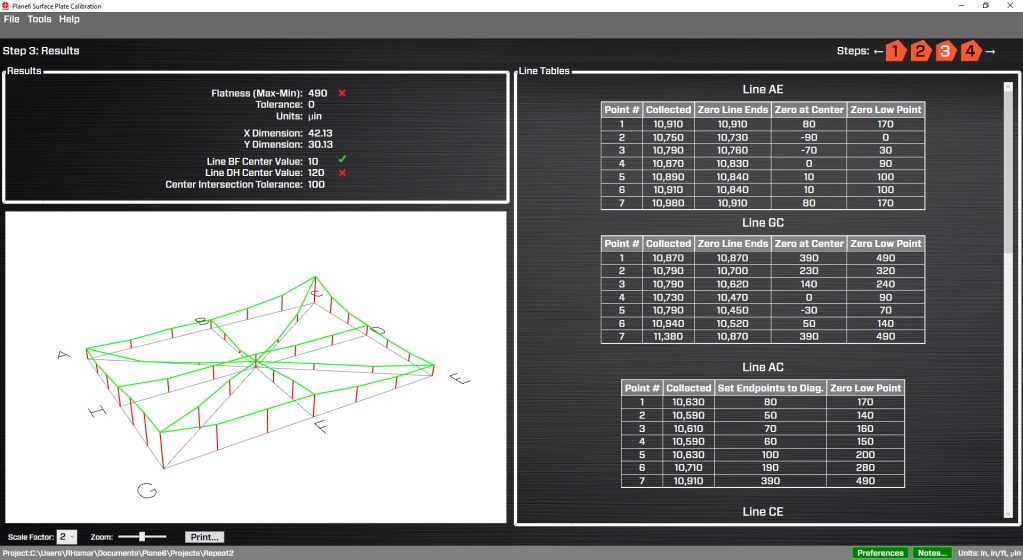
Step 3: Results shows the plate grade tolerance, dimensions, units, overall flatness of the surface plate and whether it is in or out of tolerance. It also calculates the Center Intersection data check for lines BF and DH and compares it to the recommended Moody Method tolerance. The screen shows a graph of the flatness of each line and also displays the data tables and calculations for each line. You can also zoom in on the graph. You can also print the report from this screen.
Step 4: User-Adjustable Graph
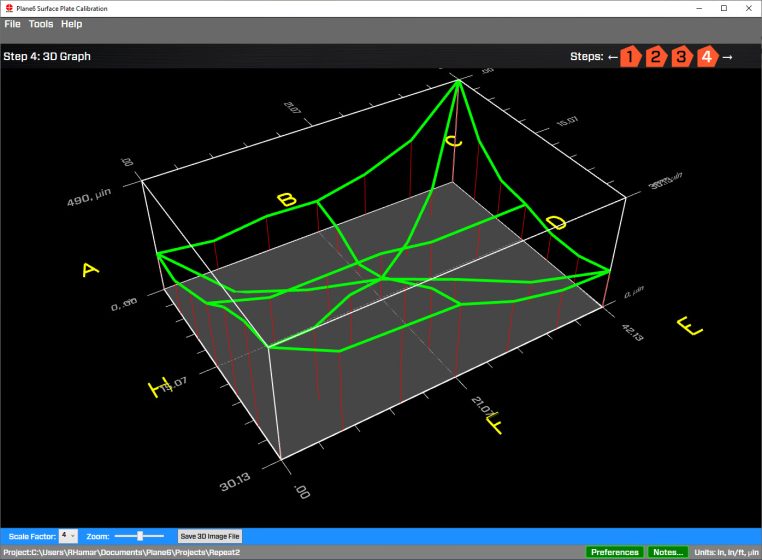
Step 4: User-Adjustable Graph is used to change the view, zoom in and out and to increase the scale factor, allowing the user much more control over the graph. When printing, Plane6 remembers how the graph was set when you printed the report.
Specifications
Drawings
- Call Us: +1-203-730-4600
- Email: sales@hamarlaser.com
- Website: www.hamarlaser.com