
Description
Hamar Laser’s Plane5 software analyzes almost any layout for flatness, squareness and parallelism. Surface shapes, such as squares, rectangles, frames, circles, rings, and up to 5 sets of ways can all be easily analyzed and plotted using 3-D graphs. The program is compatible with all of Hamar Laser’s old and new continuously rotating lasers, and several different target/interface combinations can be used to download data.
Applications
Features
Program Features Include:
- Fast and easy setup
The laser setup wizard provides an easy-to-follow list of steps to quickly and simply set the laser plane parallel to any surface. On-screen instruction panels and online help are available throughout the program. In addition, a Moody Method grid can be set up for use with electronic levels, interferometers and autocollimators. - Large number display
Target readings can be seen from a distance of 30 feet (10 M). - Graphs and analyzes multiple surfaces and shapes
Up to 3 surfaces, 1 horizontal and 2 vertical, can be graphed and analyzed in the same file. Multiple surface shapes (squares, rectangles, ways, frames, circles and rings) can easily be measured and analyzed using 3-D gaphics. - Powerful plotting and analysis tools
The plots show the least-squares best-fit plane with shaded graphs to indicate high and low points, grid lines and the slope high point of the best-fit plane. Variable zooming and rotation capabilities allow small sections of surface plots to be analyzed in either fine or coarse mode. The Surface Elevation Scale is shown as two walls behind the plotted surface, with a color scale indicating the relative values of each color on the plot. The Surface Annotation Feature shows X, Y, Z dimensions to any measured point on the plot surface. - Multiple Plot Presentation Methods
Raw Surface Flatness (as measured) shows data relative to the laser plane and the best-fit plane.
Surface-to-Best-Fit Plane shows ( after performing the Least-Squares, Best-Fit analysis) how far each data point is from the best-fit plane.
Best-Fit to Laser Plane shows how far out of parallel the best-fit plane is from the laser plane. - Automatically senses connected equipment
The program automatically checks for and loads information for the connected target and interface. - Random data mode
Random data mode allows the program to run without hardware, for training or user familiarization prior to performing an actual alignment. - Generates comprehensive alignment reports
Reports may be created, saved and printed from recorded data, including printing to an Adobe Acrobat file (Adobe Acrobat software not included). Graphics of the plot, data tables for single or multiple surfaces, and comparisons of multiple surfaces can be included.
Program Features
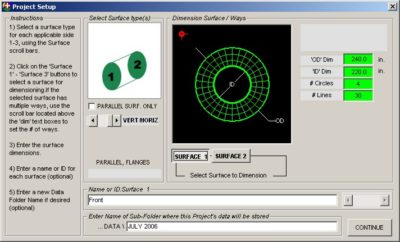
Defining a project
The Project Setup screen allows the user to define a new project. Up to 3 surfaces, 1 horizontal and 2 vertical, and their shapes (square, rectangle, frame, circle, ring or up to 5 ways) can be selected. The X, Y dimensions of each surface, as well as the number of points to be measured, are entered. The laser setup wizard can then be used to aid in making the laser plane parallel to reference points.
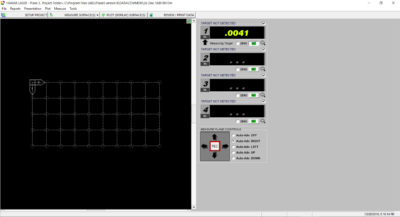
Taking data
The Data Taking screen displays a grid of one of the surfaces to be measured. Using the mouse, the cursor is moved to the first data point and the space bar is pressed, recording the measurement. The software marks the recorded point with a circle and automatically moves to the next point. When the cursor is placed on a point already measured, the software displays the X, Y coordinate and the measurement. Data can be retaken for any point, if necessary.
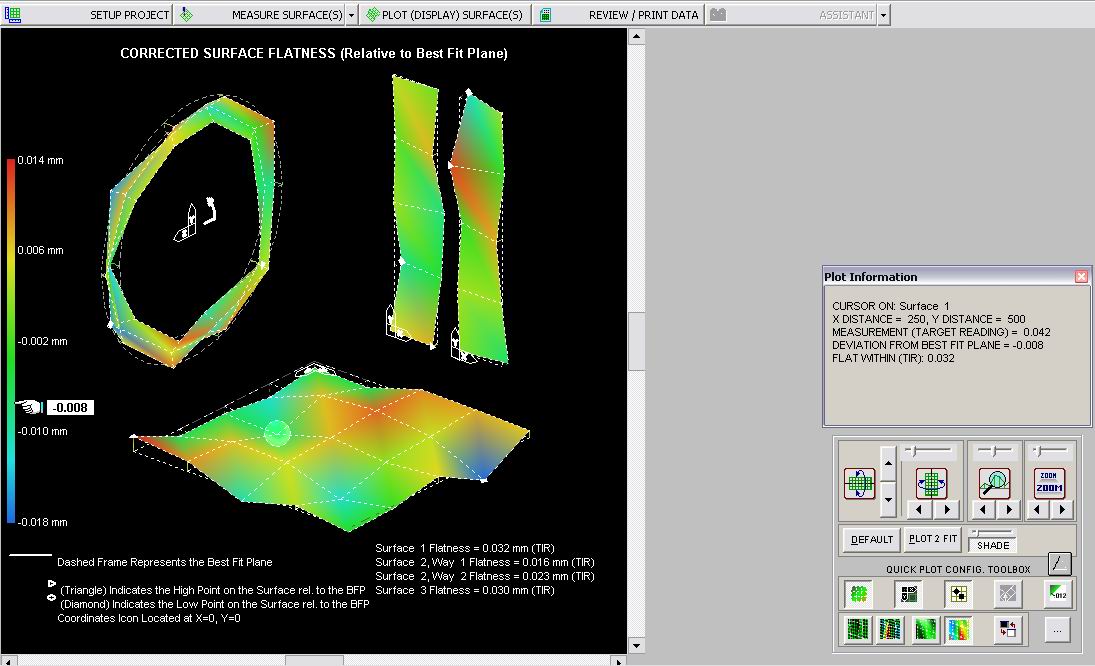
Plotting Data
The Data Plotting screen graphically displays a 3-dimensional plot of surface flatness. Up to 3 surface plots (1 horizontal and 2 vertical) can be displayed on the graph. For each surface, the data is plotted and the least-squares best-fit plane is drawn. The graph can also display high and low points, grid lines and the slope high point of the best-fit plane. Adisplay box shows the X, Y coordinates and the measurement point where the cursor passes over each point on the graph. The TIR and the high and low points are also shown for each surface. The user can rotate each graph and zoom in on certain sections for detailed analysis.
Another plotting option is a parallel surface plot, depicting the parallelism of either vertical or horizontal surfaces and providing the results in either inches/foot or millimeters/meter. This plot compares the slopes of the least-squares best-fit planes for both sets of data, providing the parallelism. Plane5 can also calculate the squareness between the LSBF planes of vertical surfaces to horizontal surfaces.

Generating Reports
Create and save a report from any recorded data. The user can select a variety of configuration options, including graphics of the plot and data tables for single or multiple surfaces. If multiple surfaces are measured, a comparison of the surfaces is provided.

Specifications
Drawings
- Call Us: +1-203-730-4600
- Email: sales@hamarlaser.com
- Website: www.hamarlaser.com